The measurement architecture
The site is built with Astro, so tracking is written into the application code rather than injected by a fragile tag container. Every data point is sent natively to GA4, with a documented naming convention.
- Native GA4 property:
content_groupgroups pages by content type, with no regex to maintain. - Tarteaucitron CMP: third-party services stay blocked until the visitor has given consent.
- Consent Mode v2: the consent state drives GA4; cookieless signals feed the modeling of missing data.
click_storeevents: a custom event on every click to the App Store or Google Play, carrying the target store and the click placement.
// 1. Consent Mode v2: everything is denied until the CMP answers
gtag('consent', 'default', {
  ad_storage: 'denied',
  ad_user_data: 'denied',
  ad_personalization: 'denied',
  analytics_storage: 'denied',
  wait_for_update: 500,
});

// 2. Custom event emitted by the code, not scraped from the DOM
gtag('event', 'click_store', {
  store: 'google',            // google | apple
  click_placement: 'navbar',  // navbar, homepage, article_full...
  link_text: 'Get it on Google Play',
});
Simplified, illustrative excerpt.
30-day results
Reporting period: 11 October to 9 November 2026. Changes are compared with the previous period.
3,322
Active users
+173.4%
105
Users sent to a store
+75.0%
531
App first opens
+314.8%
3.16%
User → store rate
The Looker Studio dashboard
The report is organized into five pages. Each one answers a specific question and shares the same filters: device, first user source, language and date range.
1. Overview: acquisition and store clicks
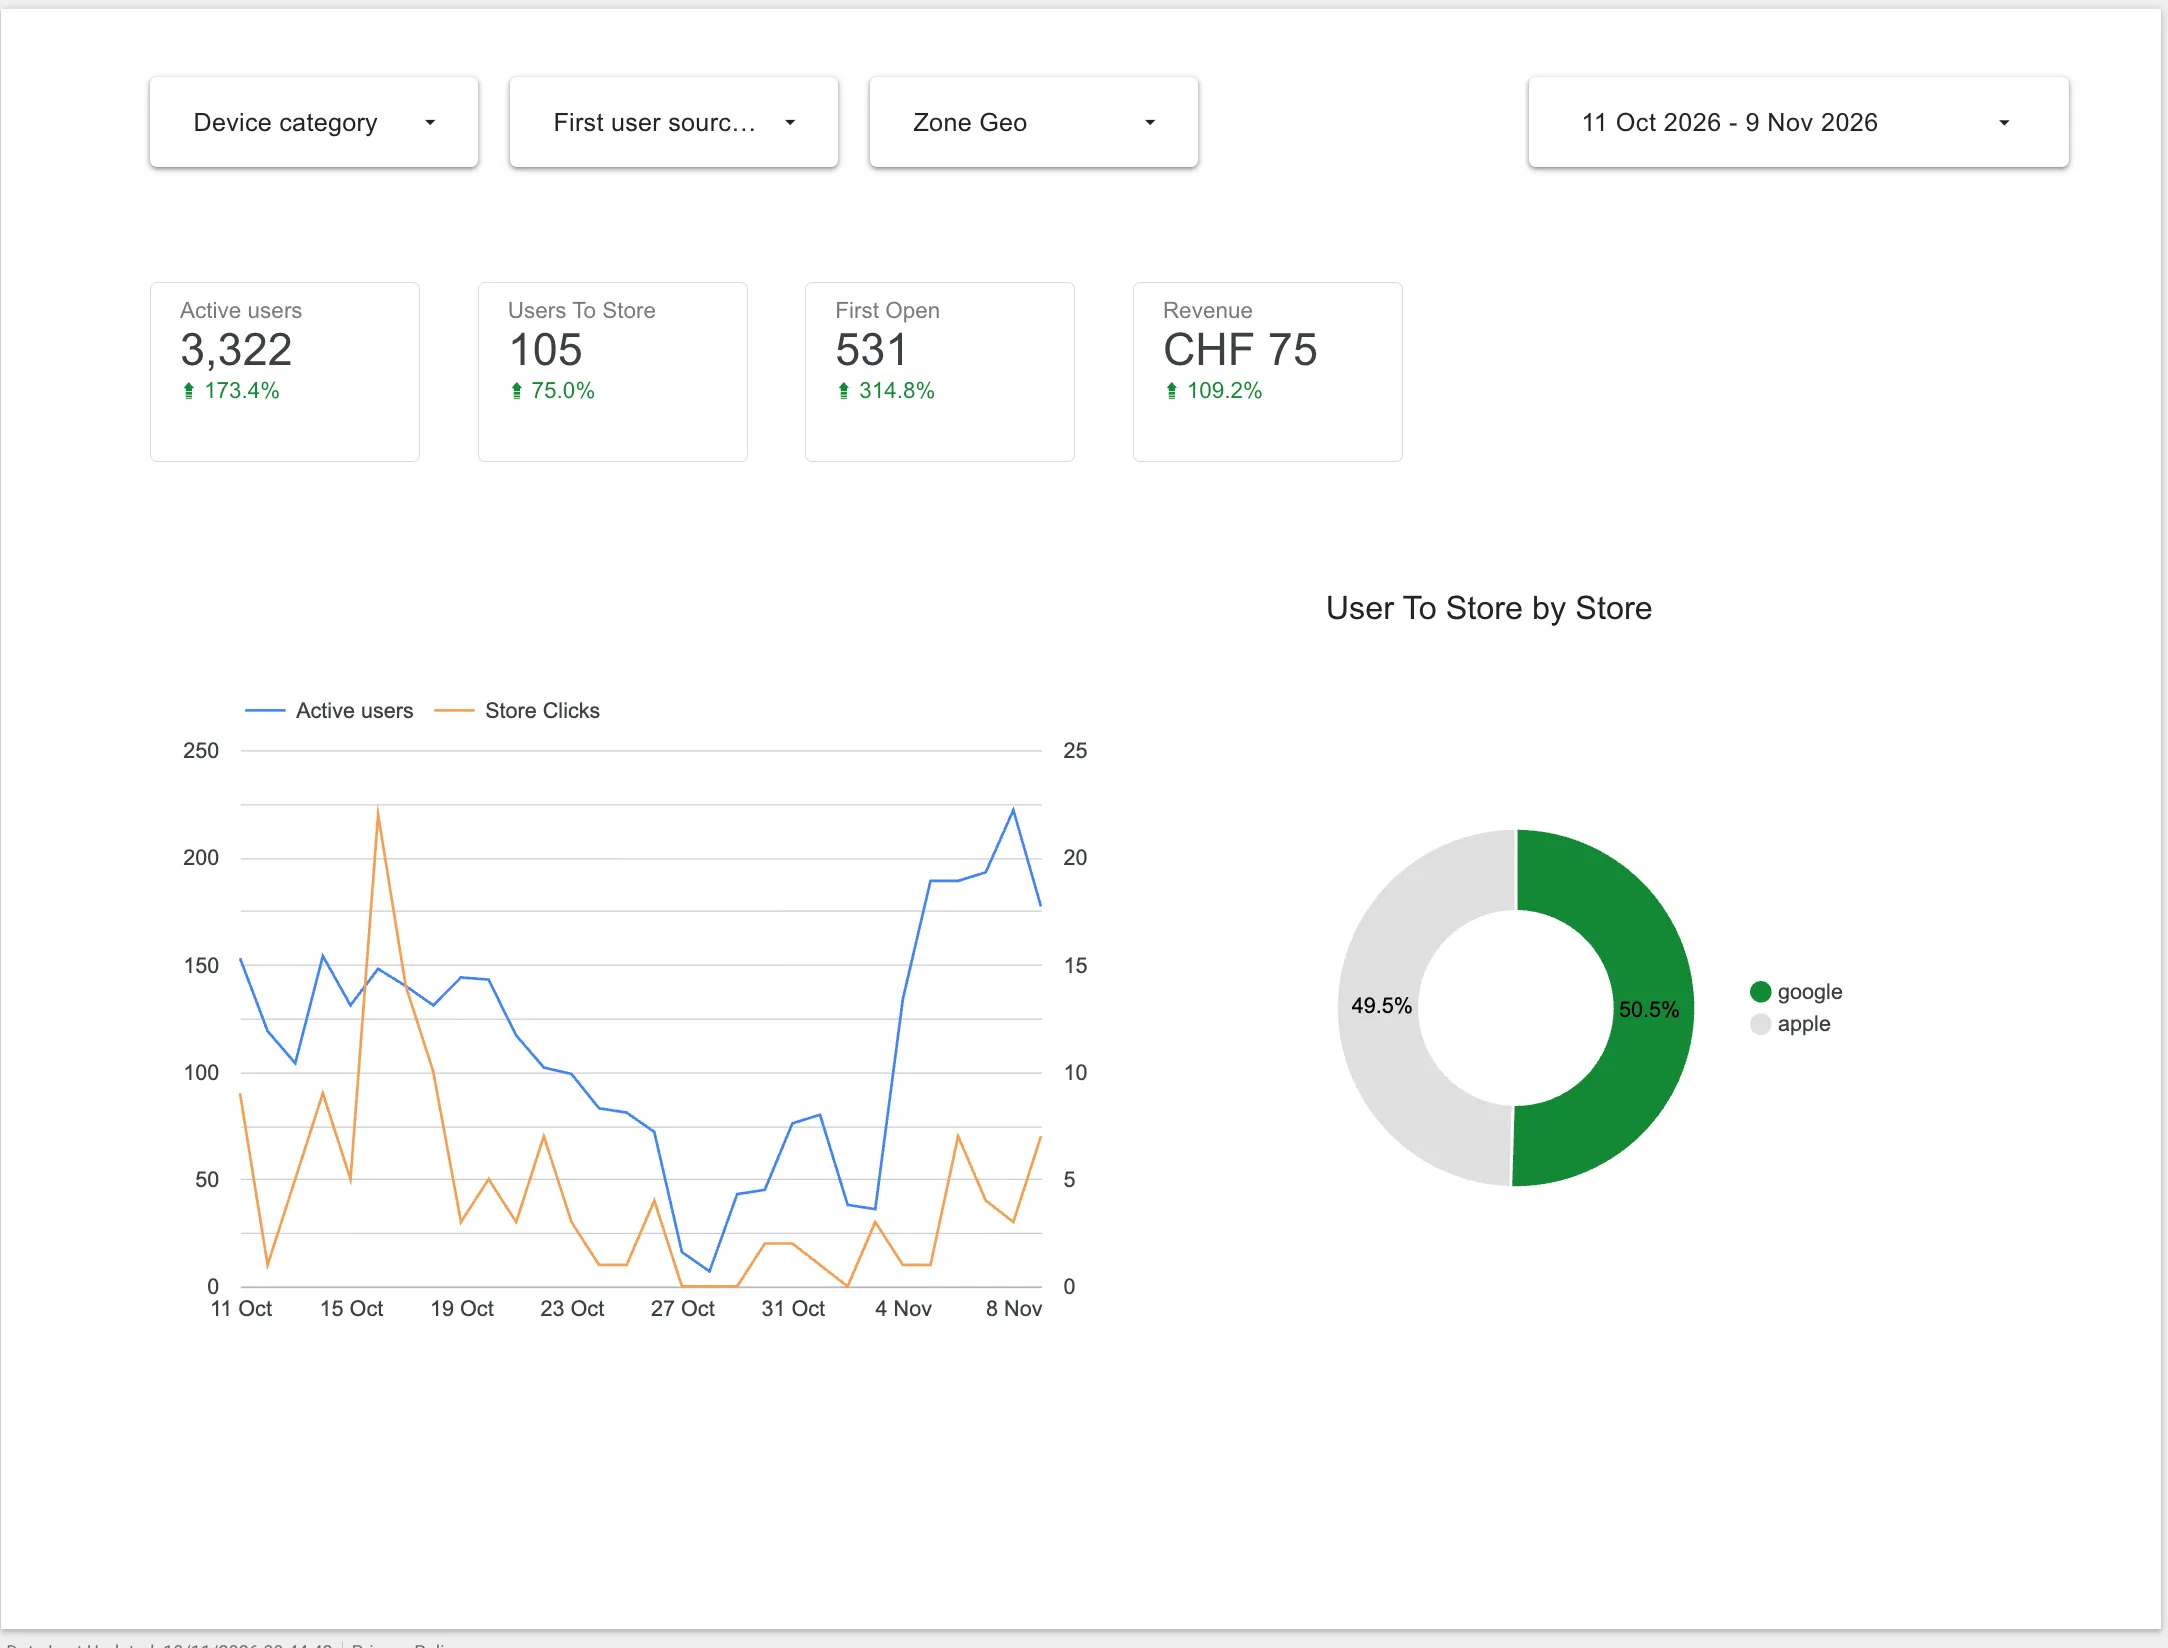
Scorecards summarize active users (3,322), users sent to a store (105) and app first opens (531), each with its trend. The line chart overlays active users and store clicks to spot peaks, and a donut chart splits clicks between Google (50.5%) and Apple (49.5%).
2. Content: which pages convert to the store
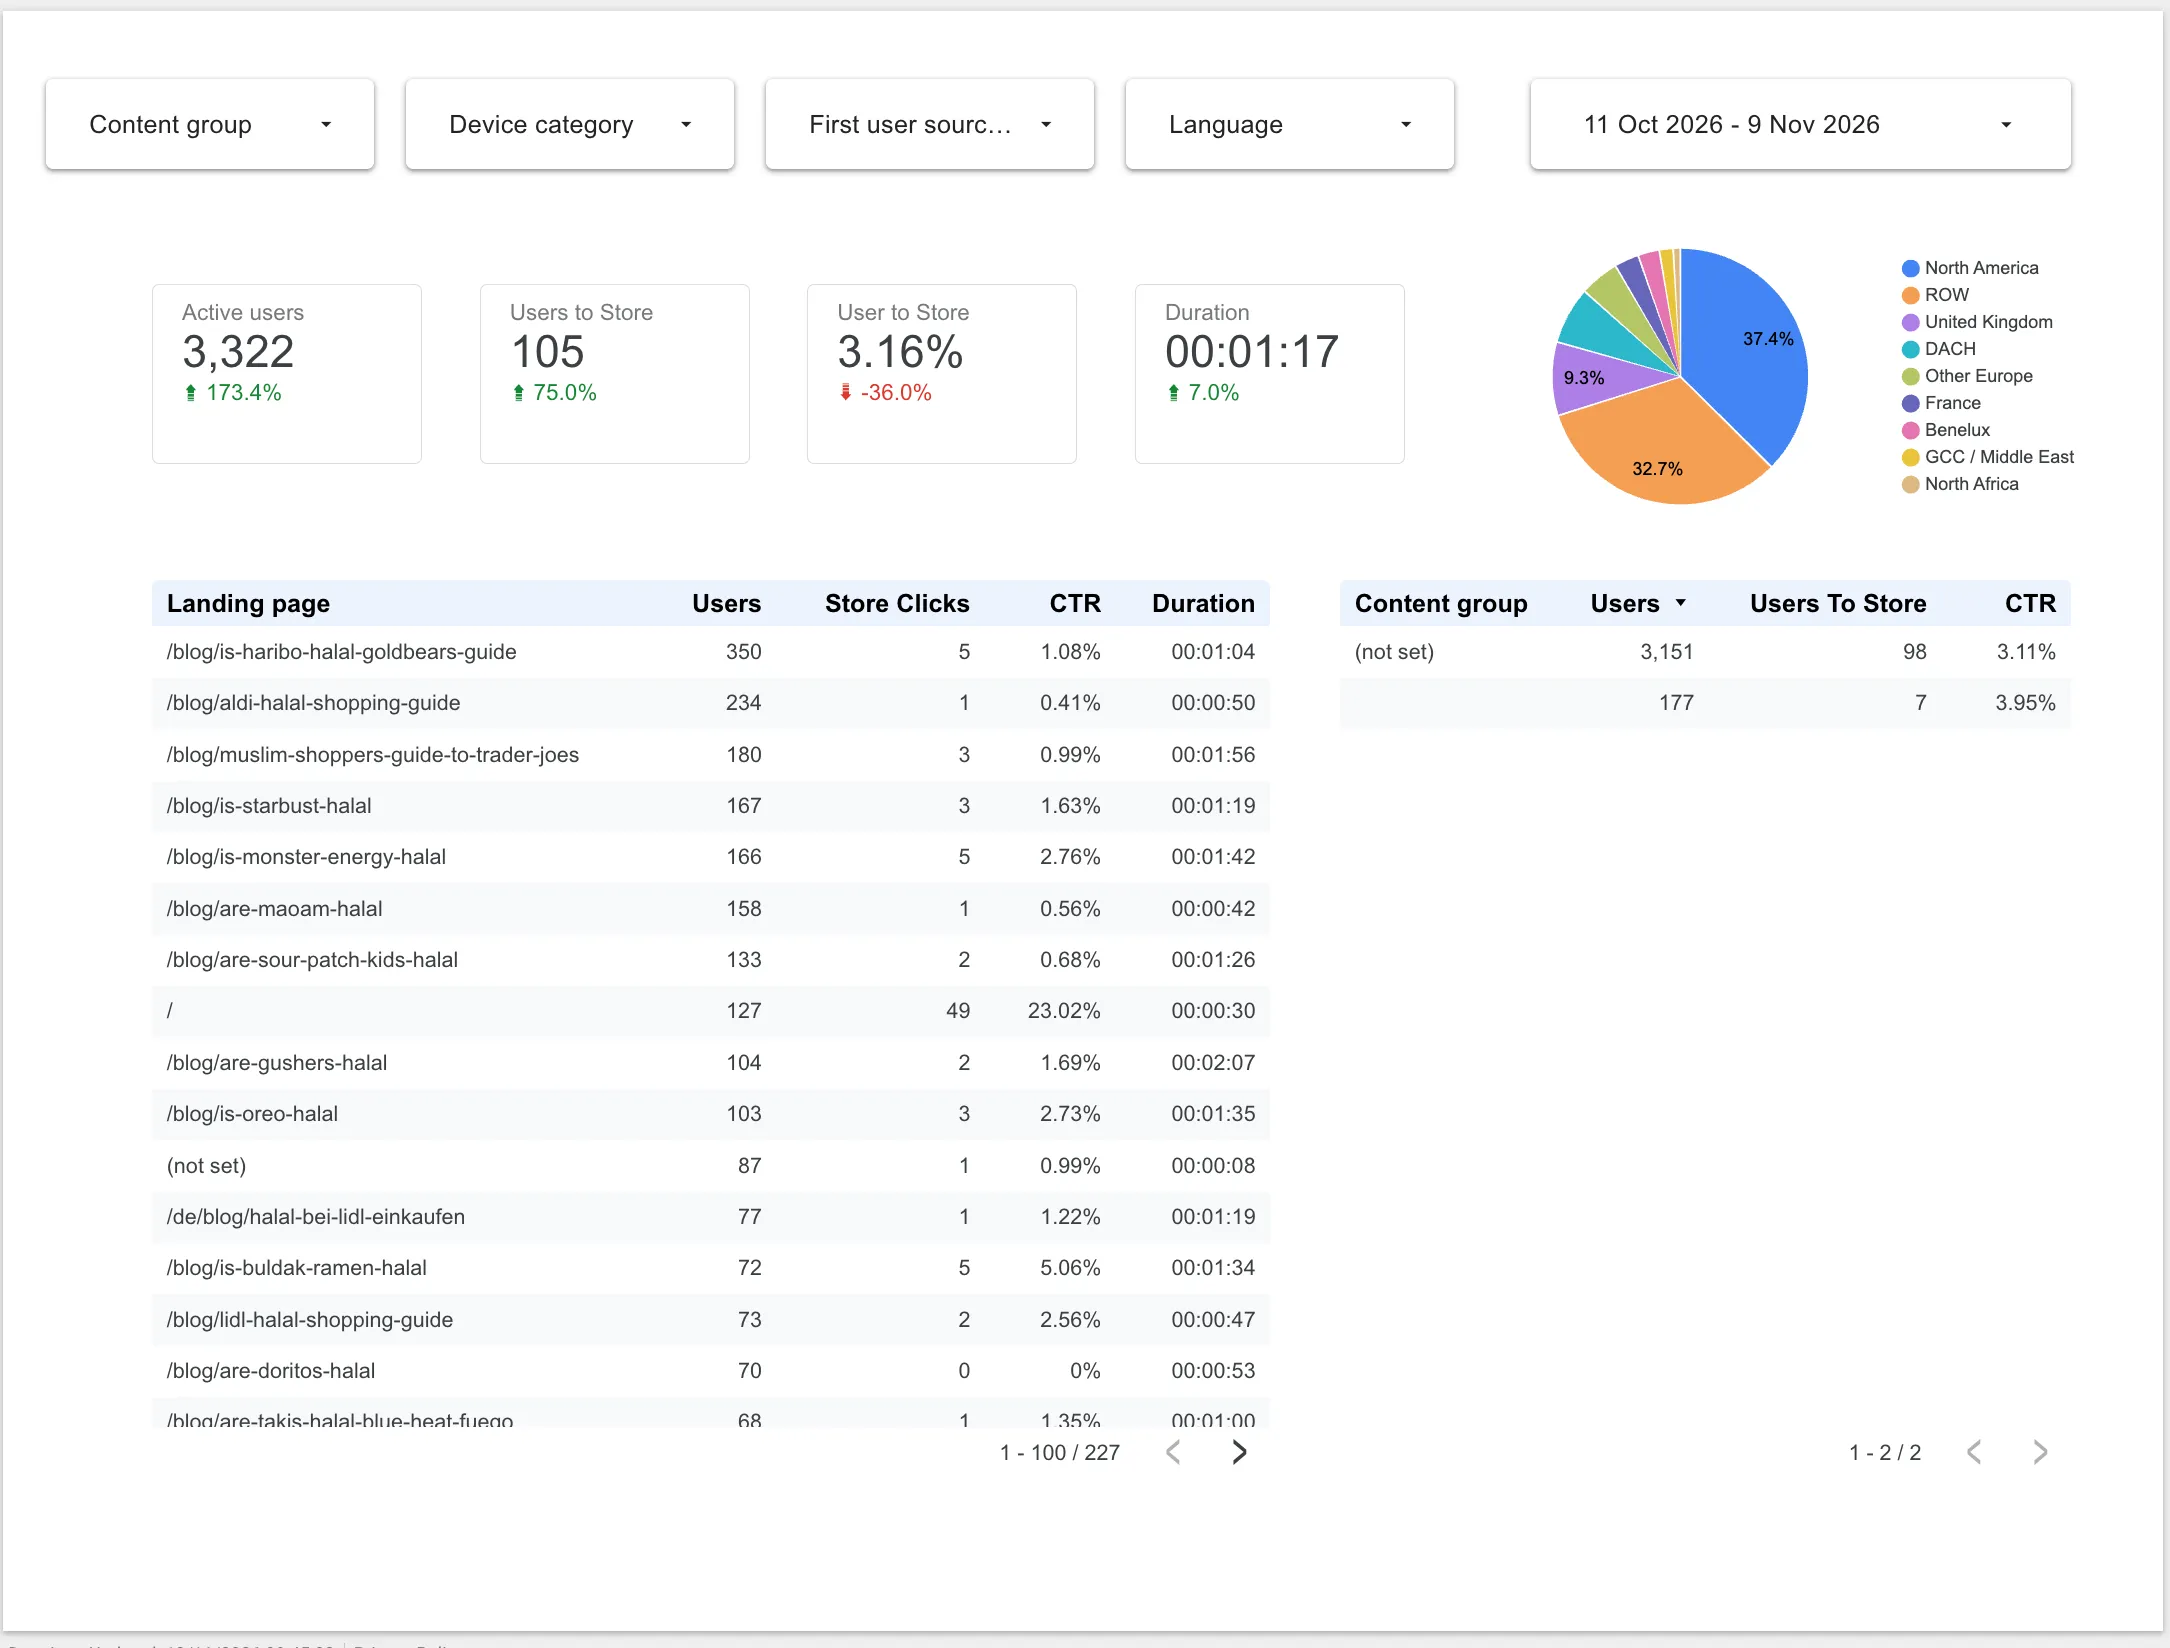
A table crosses each landing page with its users, store clicks, click-through rate and engagement time. It shows, for instance, that the homepage converts at 23.02% (49 clicks for 127 users), against 0.4% to 5% for blog articles. Average duration reaches 1 min 17 s, and a pie chart shows where traffic comes from, with North America in the lead (37.4%).
3. Placements: where the clicks happen
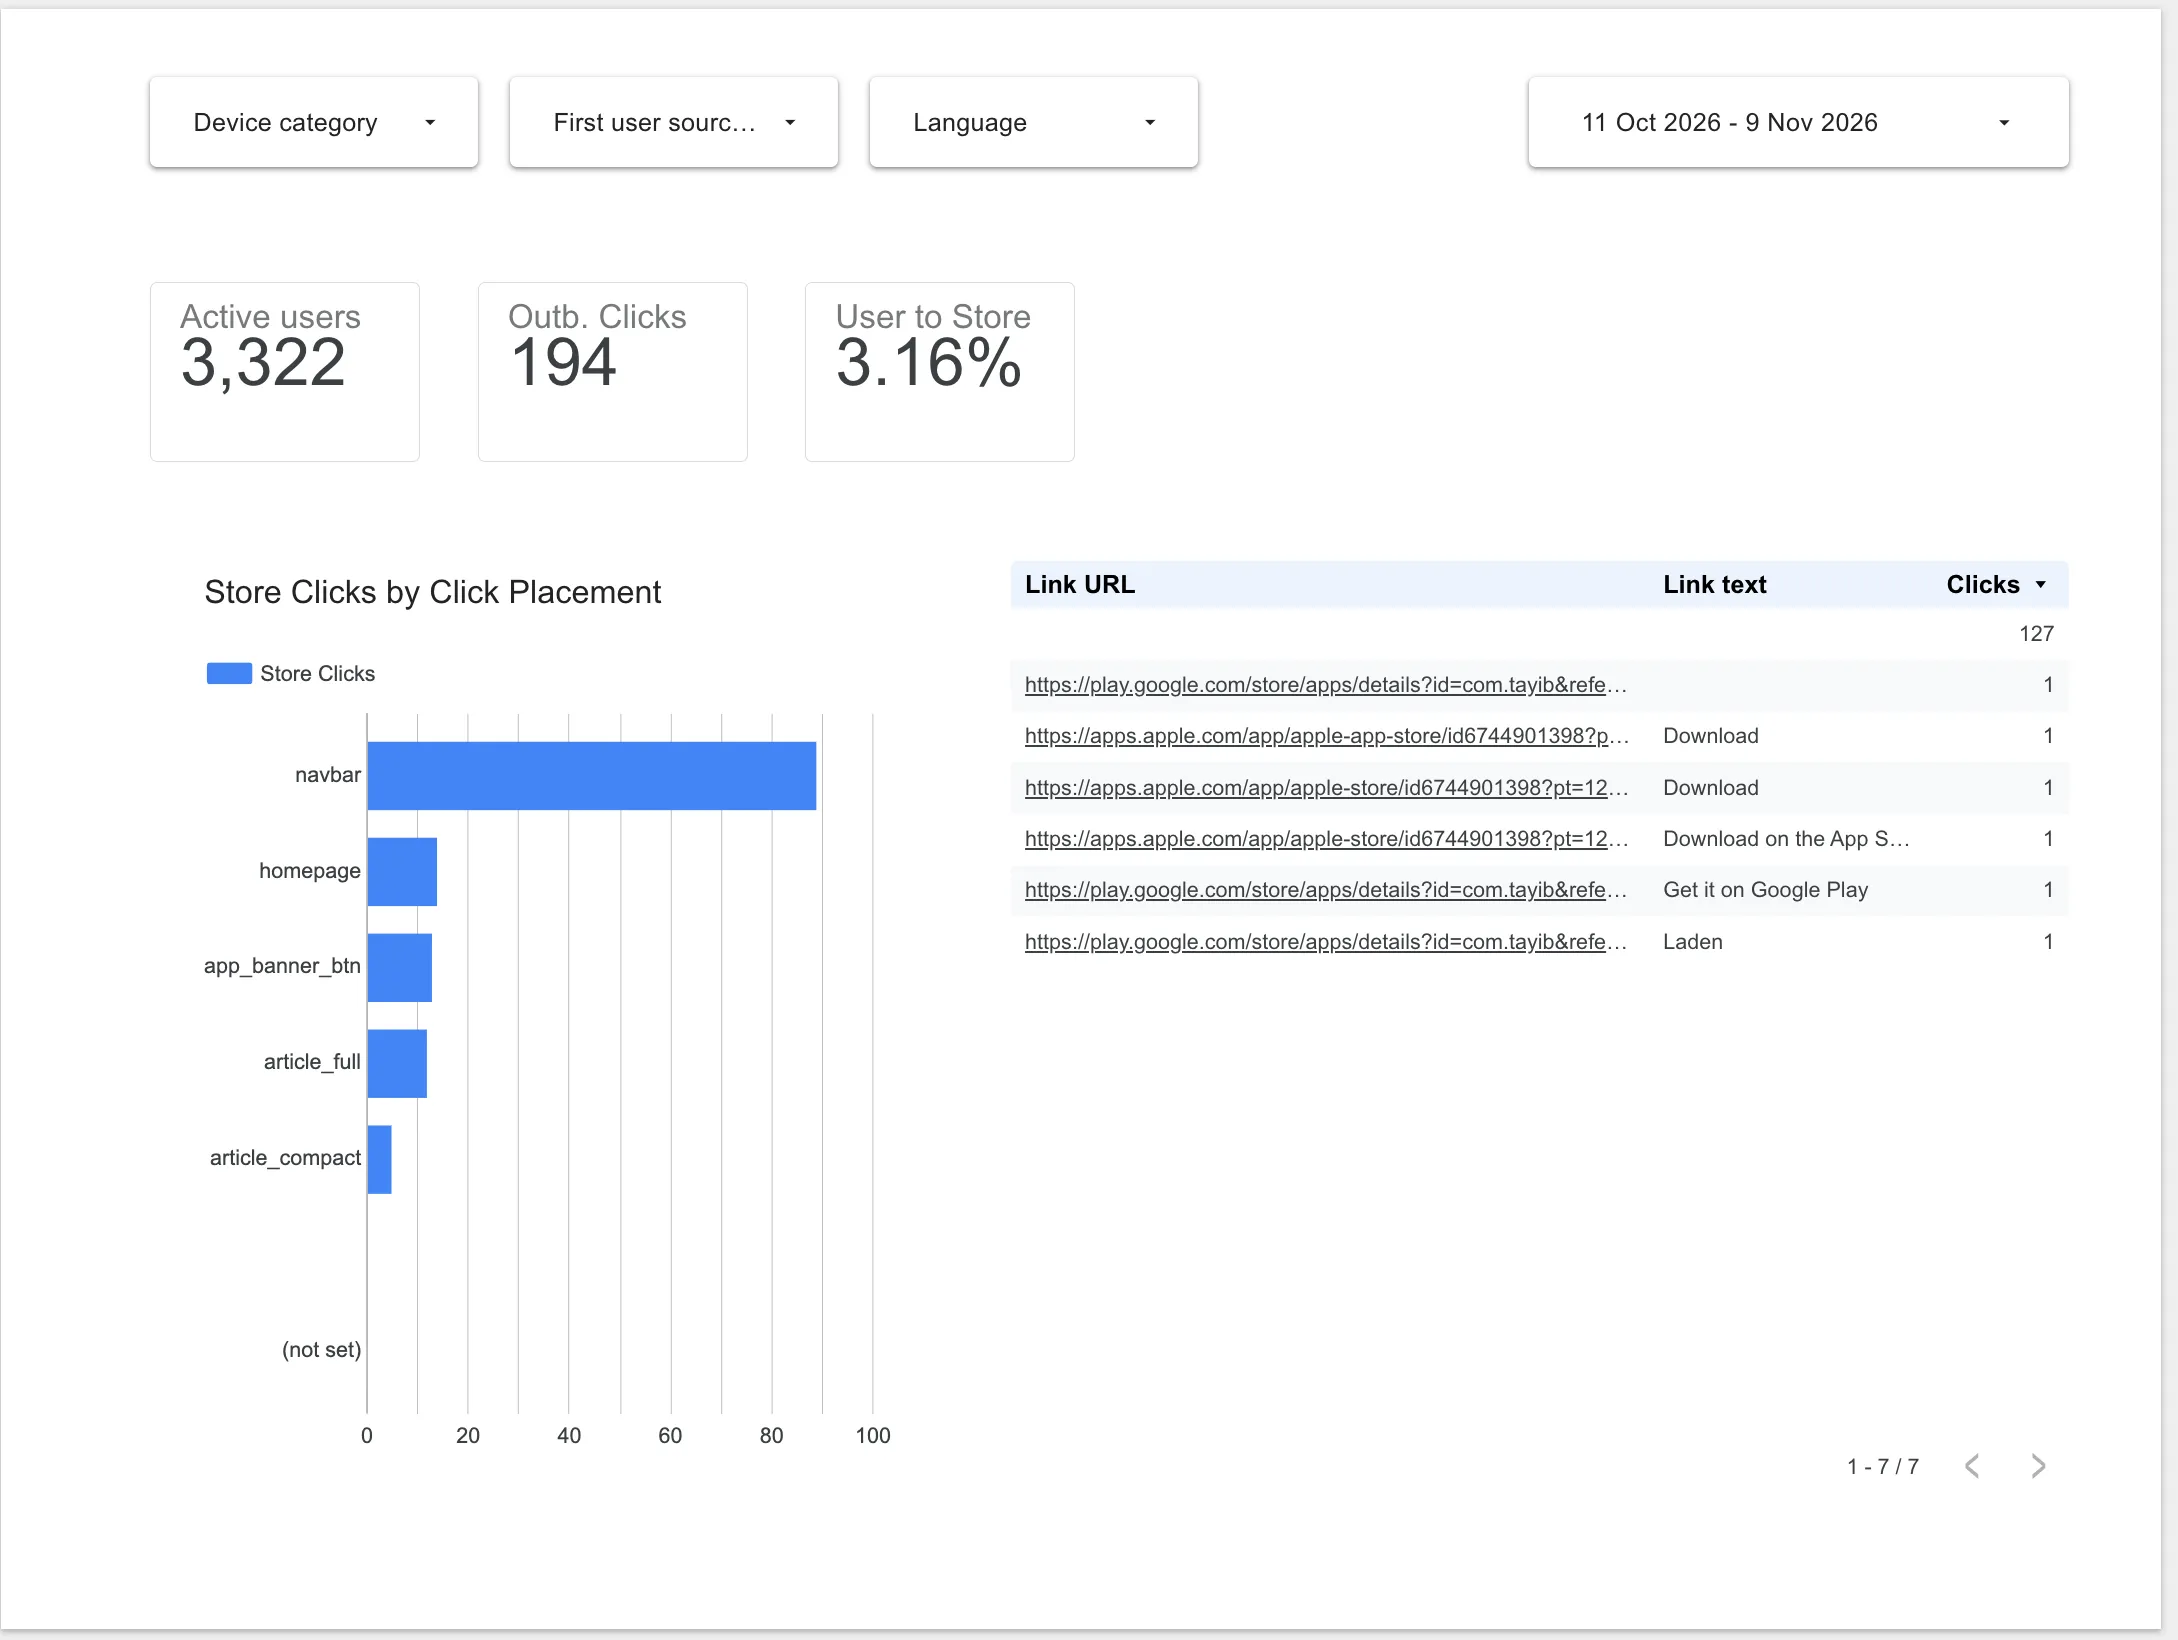
Thanks to the placement parameter of the custom event, a bar chart ranks clicks by site area: the navbar concentrates most of them (close to 90 clicks), ahead of the homepage, the app banner button and the two article card formats. A table details the URL and text of every clicked link ("Download", "Get it on Google Play", "Laden"), which also makes it easy to check the translated versions.
4. Targets: App Store versus Google Play
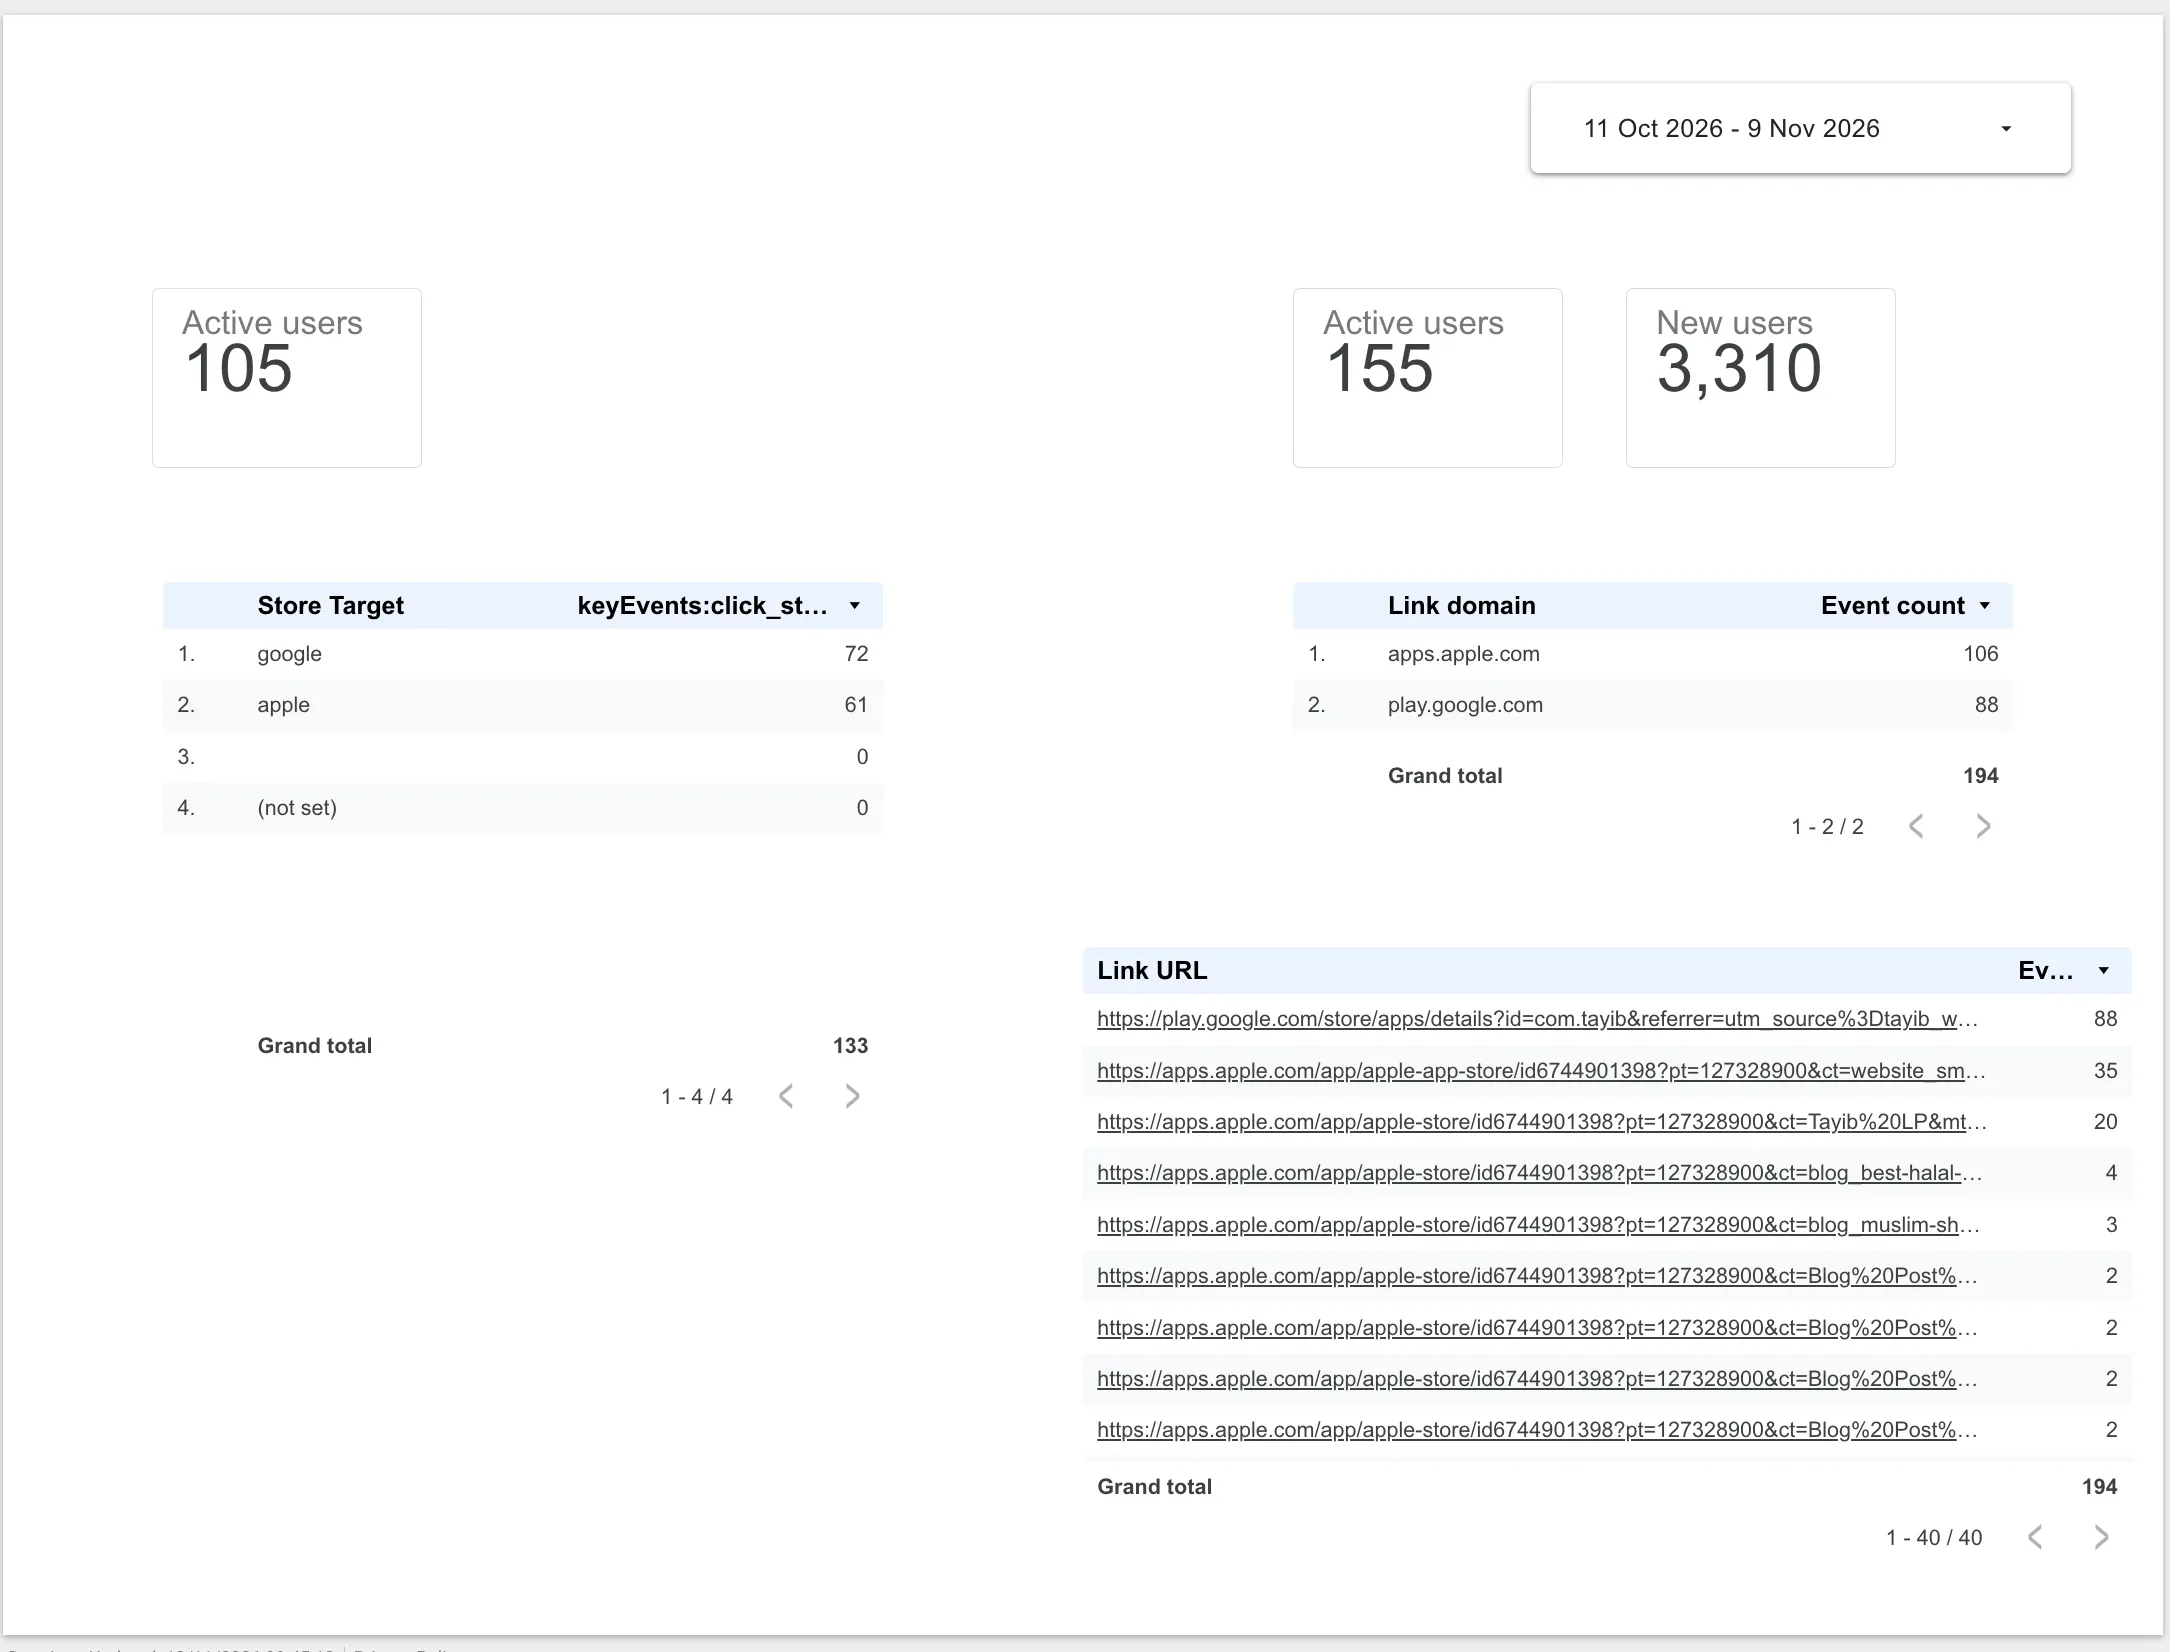
This page cross-checks the custom click_store event (133 key events: 72 to Google, 61 to Apple) against native outbound clicks by domain (194 clicks: 106 to apps.apple.com, 88 to play.google.com) and by full URL. The campaign parameters in the links tie each click back to its source.
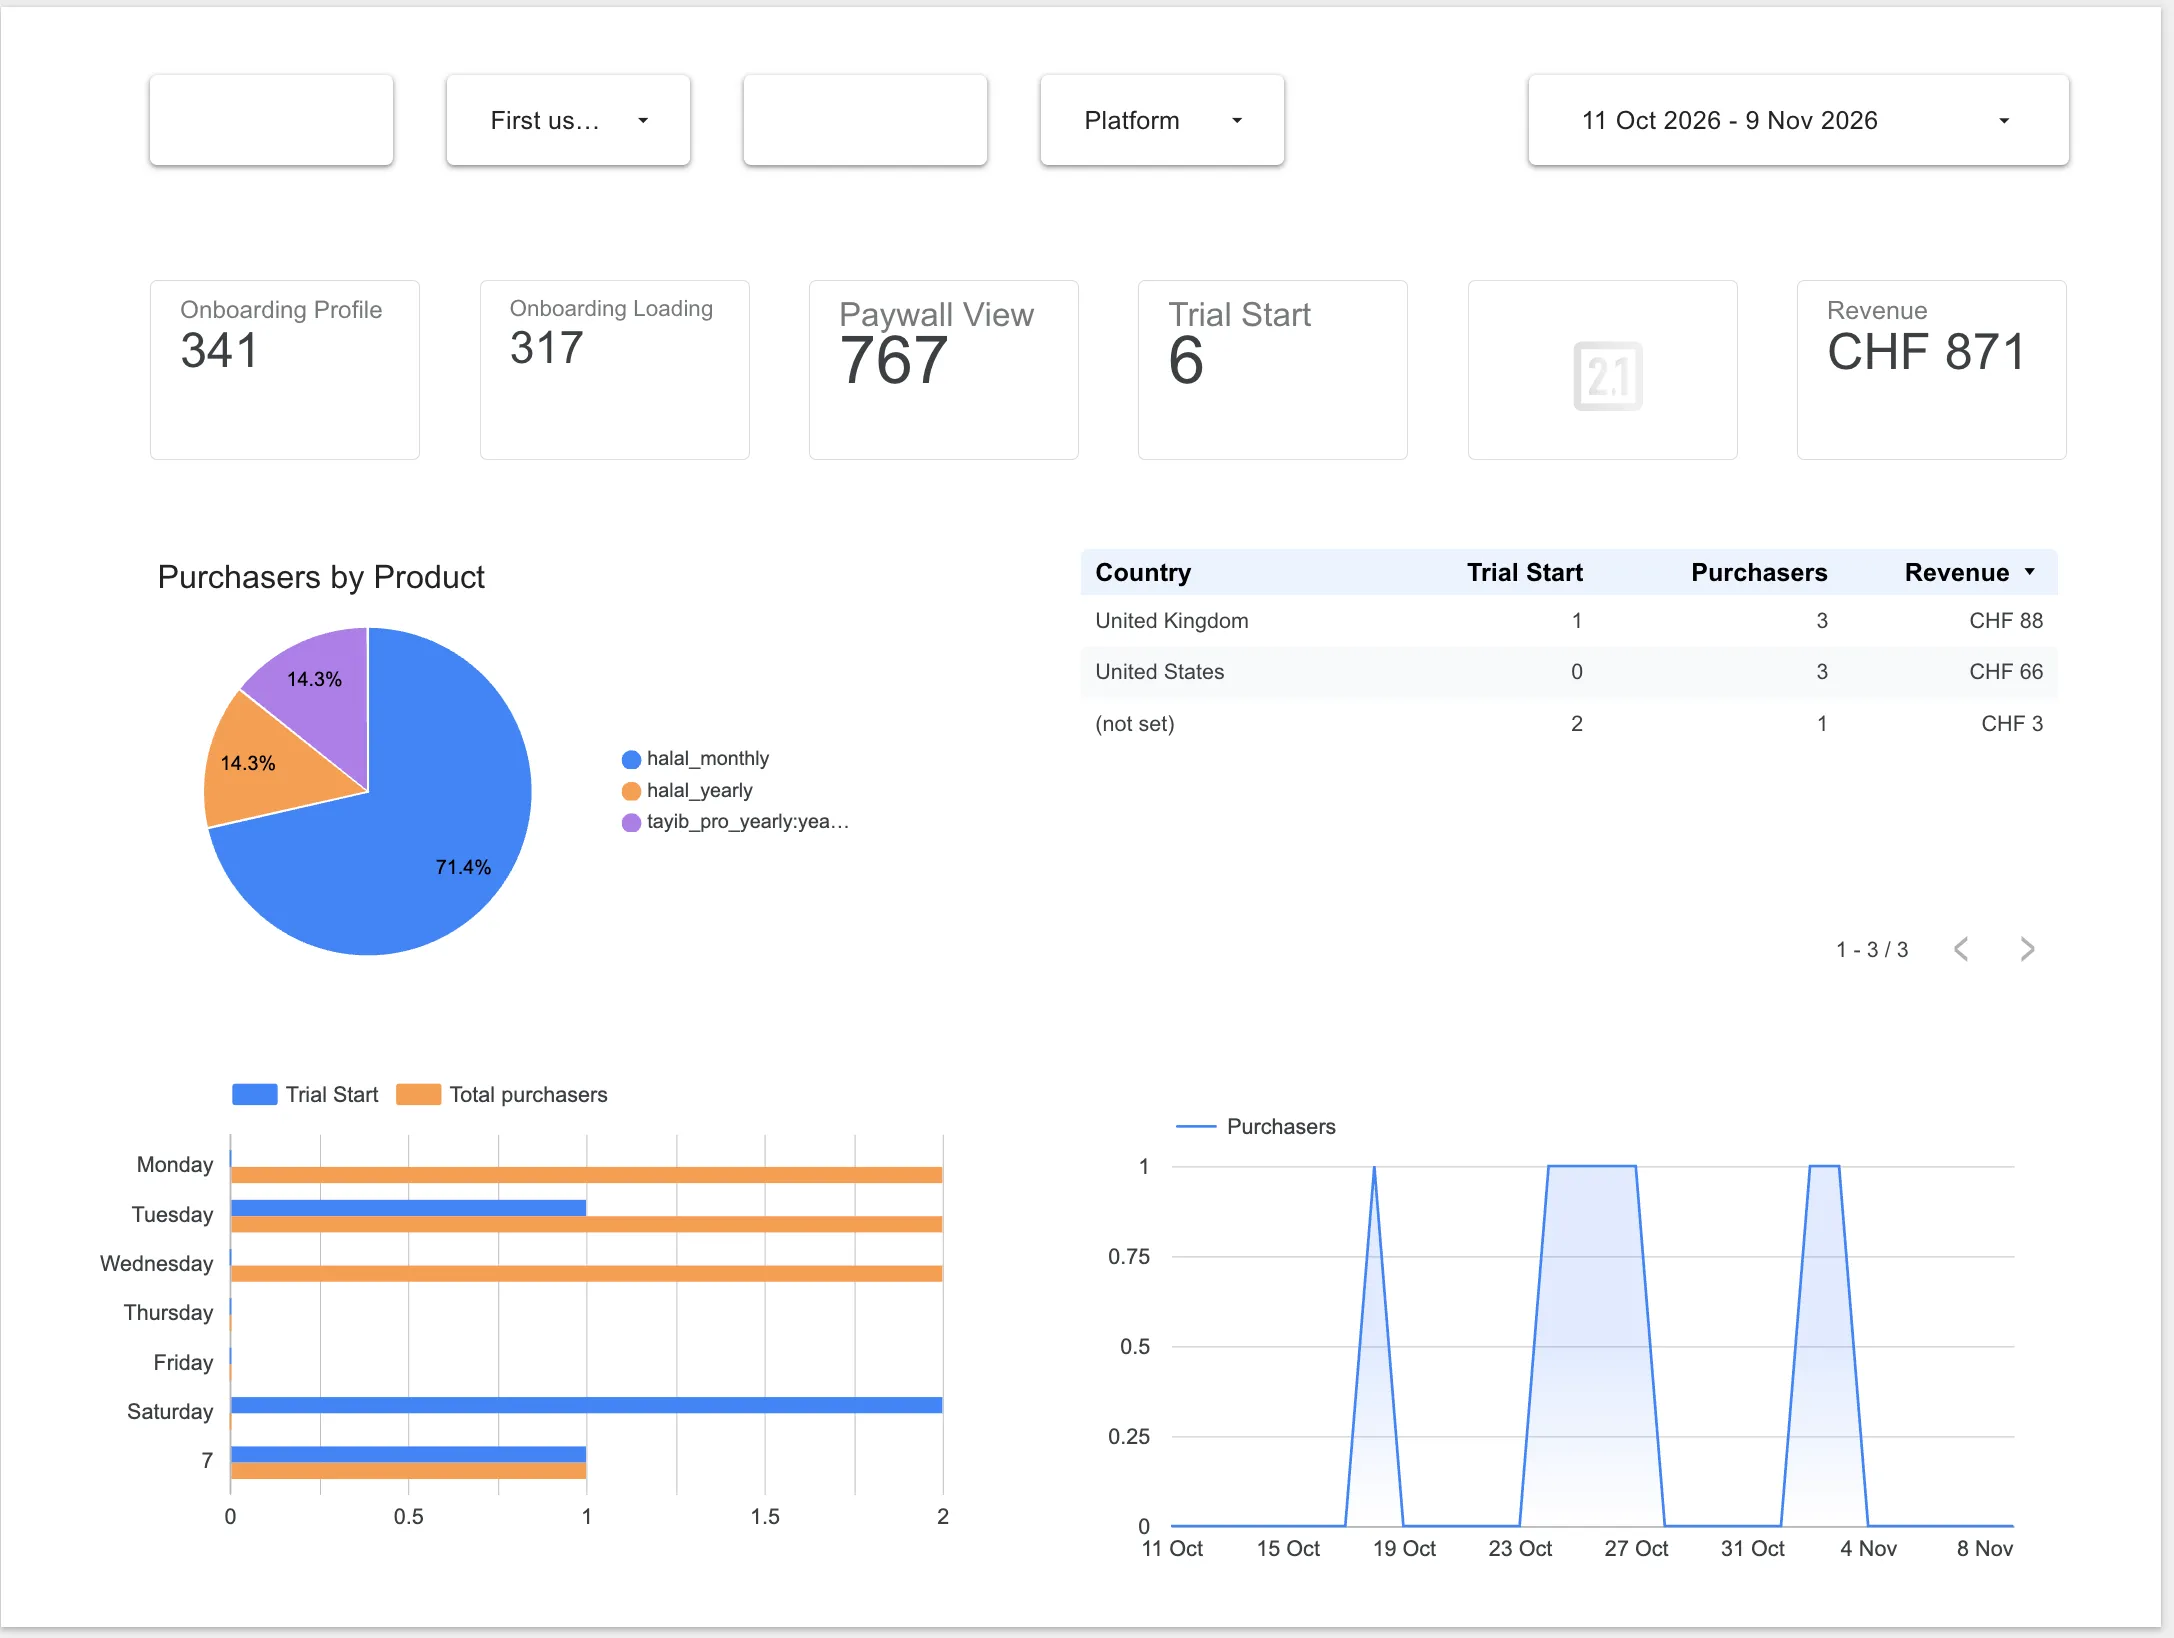
5. App: from onboarding to subscription
The last page follows the in-app funnel: onboarding profile (341), loading (317), paywall views (767), trial starts (6) and revenue (CHF 871). It then breaks purchasers down by product (halal_monthly at 71.4%), by country and by weekday, linking web acquisition to monetization.
What this project delivers
A single report now links editorial content, the click to the store and the in-app conversion, built on natively collected, GDPR-compliant data. Editorial and product decisions rely on a signal, not an estimate.